
XRP Price Sees Bullish Move, Can Buyers Protect Upside Levels?
XRP price started a recovery wave from $2.050. The price is now back above $2.25 and might attempt to surpass the $2.420 resistance zone.
- XRP price was able to start a recovery wave above $2.20.
- The price is now trading above $2.250 and the 100-hourly Simple Moving Average.
- There was a break above a bearish trend line with resistance at $2.240 on the hourly chart of the XRP/USD pair (data source from Kraken).
- The pair could continue to move up if it clears $2.420.
XRP Price Starts Recovery
XRP price extended losses below $2.25 and $2.20, like Bitcoin and Ethereum. The price dipped below the $2.150 and $2.120 levels.
A low was formed at $2.066, and the price recently started a recovery wave. There was a move above the $2.20 and $2.25 levels. The price climbed above the 50% Fib retracement level of the downward move from the $2.552 swing high to the $2.066 low.
Besides, there was a break above a bearish trend line with resistance at $2.240 on the hourly chart of the XRP/USD pair. The price is now trading above $2.250 and the 100-hourly Simple Moving Average. If there is a fresh upward move, the price might face resistance near the $2.40 level.
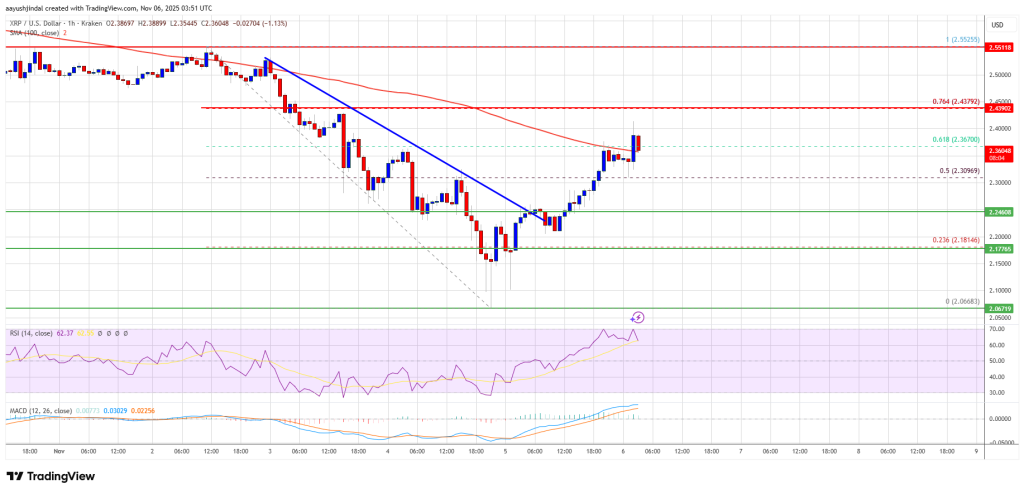
The first major resistance is near the $2.420 level and the 76.4% Fib retracement level of the downward move from the $2.552 swing high to the $2.066 low, above which the price could rise and test $2.480. A clear move above the $2.480 resistance might send the price toward the $2.550 resistance. Any more gains might send the price toward the $2.650 resistance. The next major hurdle for the bulls might be near $2.720.
Another Decline?
If XRP fails to clear the $2.420 resistance zone, it could start a fresh decline. Initial support on the downside is near the $2.280 level. The next major support is near the $2.250 level.
If there is a downside break and a close below the $2.250 level, the price might continue to decline toward $2.20. The next major support sits near the $2.120 zone, below which the price could continue lower toward $2.060.
Technical Indicators
Hourly MACD – The MACD for XRP/USD is now losing pace in the bearish zone.
Hourly RSI (Relative Strength Index) – The RSI for XRP/USD is now above the 50 level.
Major Support Levels – $2.280 and $2.250.
Major Resistance Levels – $2.40 and $2.420.