Based on the formation in the daily chart, Bitcoin is at a critical point, price-wise. As the battle between bulls and bears progresses, it is clear that sellers have the upper hand for now despite the recent price stability.
BTC Prices At A Crucial Price Level: Will Bulls Take Over?
As BTC bulls attempt to reverse losses posted last week, one analyst, citing technical candlestick formation and the reaction at the 200-day moving average, thinks how prices react for now will be consequential in the coming days.
In a post on X, the analyst noted that the coin dipped and closed below the 200-day moving average following last week’s losses. This formation was crucial.
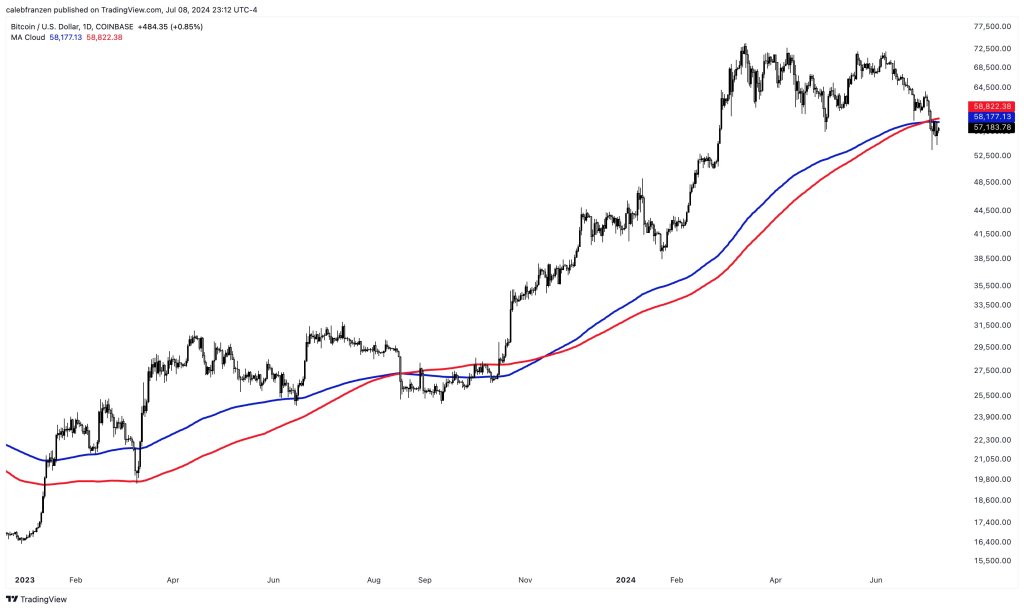
Over the months, this dynamic line had acted as critical support, anchoring buyers throughout the last bull cycle from October through mid-March.
The rally was sustained, and though the level was not retested until late June, when prices were weak across the board, the break last week was decisive.
While bearish, the analyst acknowledged that last week’s break was clear. However, as it is, there is hope for bears because there has been no confirming bear bar.
For this to happen, prices must break below $56,500 and sink below $53,500, marking last week’s low. When this happens, it will be official that bears are back, and sellers will likely continue pushing lower in a bear trend continuation formation.
If Bitcoin is to turn around, it is imperative that prices reject last week’s losses and break higher, closing above the 200-day moving average. This recovery will be the bullish signal that may mark the start of a leg up, resuming the uptrend of Q1 2024.
For now, traders are watching the psychological line at $60,000 and, ideally, the close above $66,000. In that event, Bitcoin might find the momentum to retest $72,000–an important liquidation level.
Eyes On Spot Bitcoin ETF Inflows
Even amid the optimism, traders are closely watching inflows to spot Bitcoin exchange-traded funds (ETFs), especially in light of the sustained dump by the German government. The sell-off has been heaping more pressure on BTC, capping gains, and deflating the upside momentum.
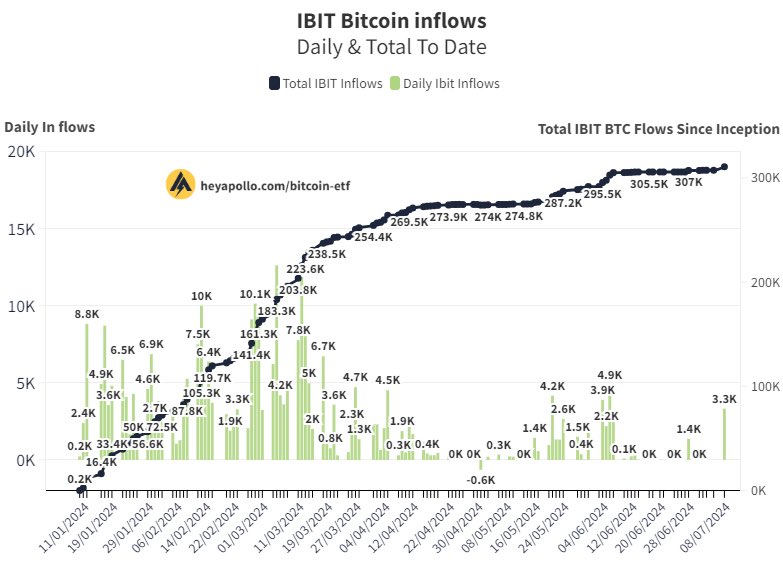
If sellers are persistent and mirror recent trends, there could be more blood, and spot Bitcoin ETF issuers might register outflows.
In the past few weeks, especially in June, when prices fell, BlackRock, Fidelity, Grayscale, and other top issuers posted outflows, accelerating the downtrend.