
Due to market volatility and Bitcoin (BTC) price fluctuations, identifying the best times to buy the pioneer cryptocurrency can be challenging. Taking this into consideration, a crypto analyst has pinpointed key price levels for investors to monitor for potential buying opportunities.
Buy Levels To Watch For The Bitcoin Price
A crypto analyst identified as ‘Stockmoney Lizards’ took to X (formerly Twitter) on August 1 to discuss Bitcoin’s recent price movements, highlighting key buy levels and the cryptocurrency’s propensity for a price increase. The analyst notes that Bitcoin’s current price actions indicate a classic 5-wave uptrend followed by an ABC correction with an overarching wave B.
An ABC correction is a continuous pattern that occurs during uptrends or downtrends. It is a pattern within the Elliott Wave Theory that reflects a three wave correction and helps identify a trend continuation.
Sharing a Bitcoin price chart illustrating each wave (A, B, and C), the analyst disclosed that Wave B ended at the Value Area High (VAH) around the $69,885 mark. According to the analyst, this price level historically acted as a resistance. This means that Bitcoin’s price may face difficulty moving above this point.
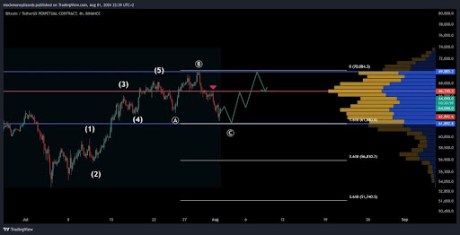
The analyst further revealed that the $66,745 price point also acted as a resistance level for Bitcoin. He highlighted this critical level on the BTC price chart, emphasizing that the red line represents a Point Of Control (POC) for the cryptocurrency.
Moreover, the 1.618 Fibonacci retracement level and the Value Area Low (VAL), which are all important support levels.
Concluding his analysis, the crypto analyst suggested that the support area between $61,800 and $62,300 was an important buying level to watch out for. He noted that on the higher timeframe, Bitcoin’s potential uptrend was still intact, adding that if the cryptocurrency’s price breaks below the $61,800 mark, then a further decline to test the 2.618 Fibonacci extension at $56,800 should be expected.
Overall, the crypto analyst is leaning towards a bullish outlook for the short term and mid term timeframes in Bitcoin’s price. At the time of writing, Bitcoin is trading at $61,594, reflecting a 4.21% decline in the last 24 hours, according to CoinMarketCap.
BTC Poised To Breakout In September
Other analysts have also remained relatively bullish on Bitcoin’s price, predicting rallies to new all-time highs for the pioneer cryptocurrency. According to a crypto analyst identified as ‘TOBTC’ on X, Bitcoin experienced a significant decline in its price, falling below the $63,000 price mark.
The analyst new all time highs in September or October 2024.